

There’s been a lot of back-and-forth on Twitter regarding the use of Alexi Amarista. There was some pushback to my assertion that his value is zero, as I stated in our Ranking the Padres series, based on the grounds that Amarista has been playing well at shortstop this season.
Based on both anecdotes and his raw sabermetric numbers, this cannot be refuted on the surface. I did, however, push back on the notion of basing Amarista’s usefulness on the aggregate value of a whopping total of 70 fielding attempts when Fangraphs suggests three years of aggregate defensive data before making judgements.
However, I was curious as to whether this was truly a data anomaly – for example, maybe he had a lot of easy balls hit his way over the course of these 70 fielding attempts, which would improperly inflate his overall zone rating based on his ability to field easy plays.
So let’s take a look.
Pre-2014 Amarista at shortstop
Prior to 2014, Amarista had logged roughly 160 innings at shortstop in his Major League career. This led to a miserable -12 UZR/150, meaning over the course of 150 games played at shortstop, Amarista would cost his team 12 runs on defense compared to the average shortstop. Not good. Actually, that’s very bad.
I wanted to see if maybe this was simply the result of a lot of hard-to-field balls in a small sample, but the evidence shows that wasn’t really the case.
Here’s his fielding chart, available thanks to Inside Edge at Fangraphs, where trained eyes plot both the position, difficulty, type, and result of every batted ball. This is showing the location of each ball batted to him for 2012-2013.
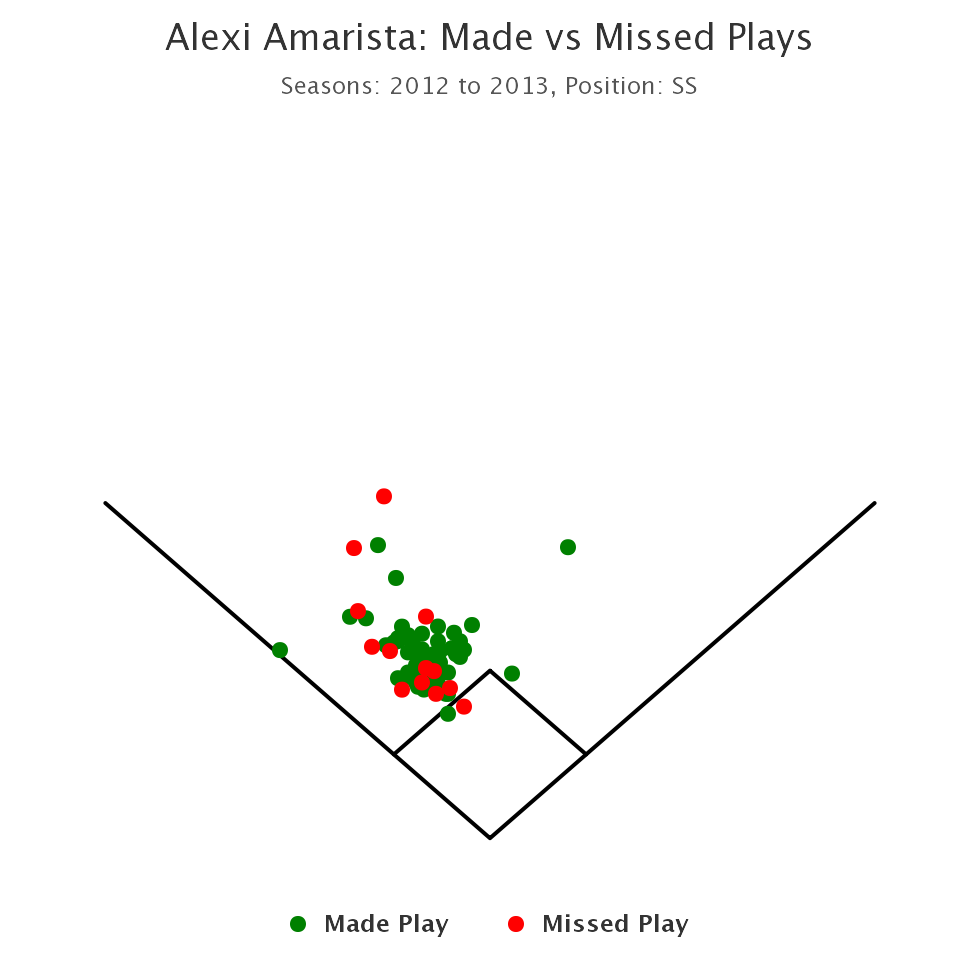
A few things stand out:
- Not a lot of plays made outside of his zone.
- A lot of missed plays within his zone.
That combination is not good, but before we confirm this, we should take a look at the quality of each missed play to see what exactly he wasn’t fielding.
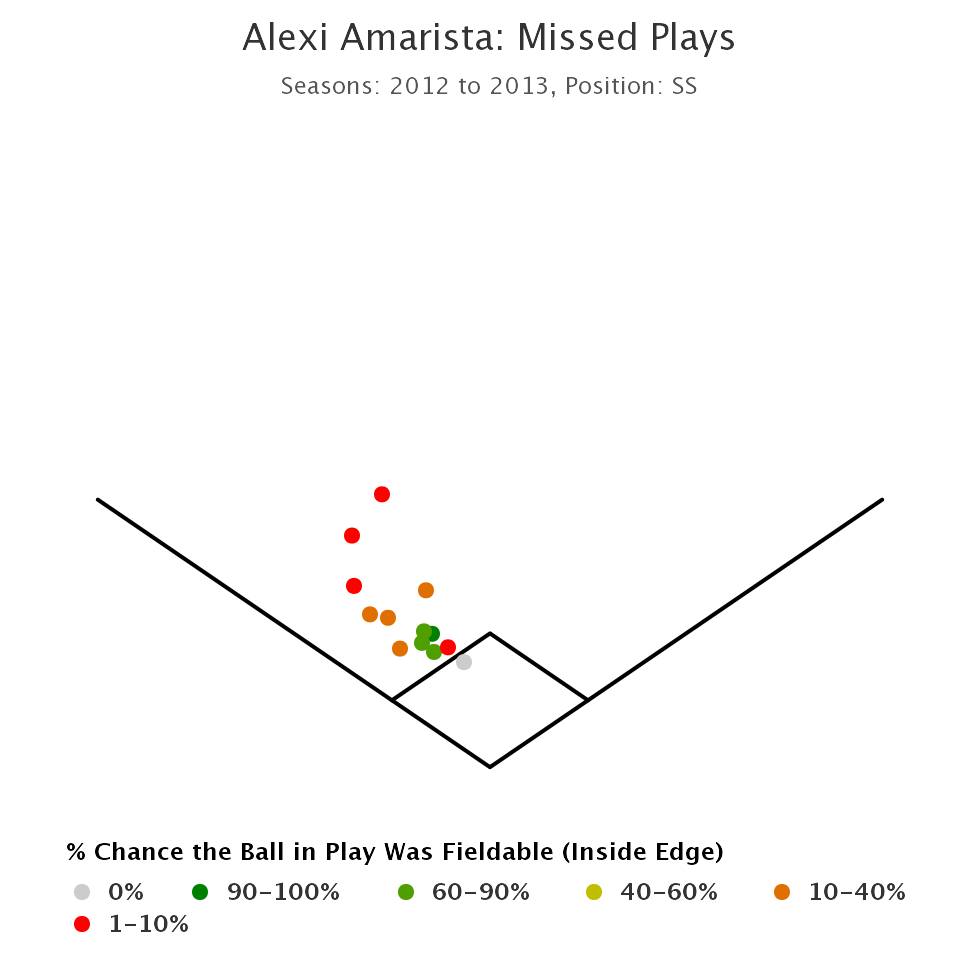
This isn’t exactly damning: while he has missed some easier-to-field (60-90%) balls and committed a fielding error on a routine ball, many of these weren’t fieldable.
Of the 60-90% attempts through 2013, Amarista fielded 5 of 8 (62.5%). Not exactly horrifying, and not exactly a significant sample, but you’d at least hope to see better than that. Of the 10-40% attempts through 2013, Amarista was 1 for 5 (20%). One step up from horrifying, but still not a significant sample by any means. Amarista was, however, 3 for 3 in in the 40-60% range, bringing his total for range 10%-90% to 9 for 16.
Based on a weighted average of the expected probability, a player is expected to field 8.75 of these. That Amarista is so close to the expected probability tells us nothing, but, more importantly, also doesn’t allow us to prove he was awful or great on these rare plays that differentiate great fielders from the bad ones.
In other words: we’ve got nothing to go on, statistically, in either direction prior to the 2014. At least not when you examine the batted ball data.
2014 Amarista at shortstop
So how has he done by those same measures in 2014?
First, his fielding chart, showing the location of each ball batted to him during the 2014 season:
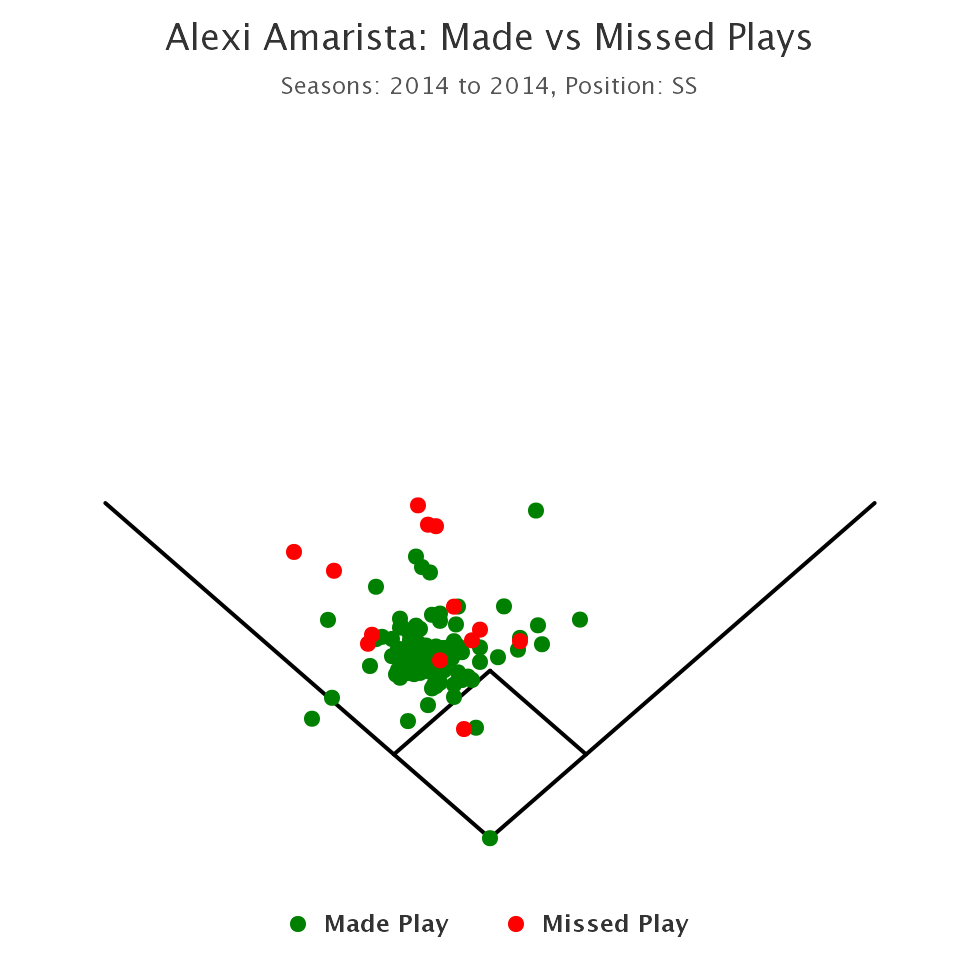
You’ll notice that this is a much wider range of plays fielded in 2014 than 2013. If you scroll over each one at Fangraphs, you’ll see that while many of the wider range ones are popups, several of them are actually groundballs. On the surface, this seems to validate that Amarista has increased his range in 2014. But this warrants deeper analysis.
Let’s take a look at the difficulty of each of those fielded balls:
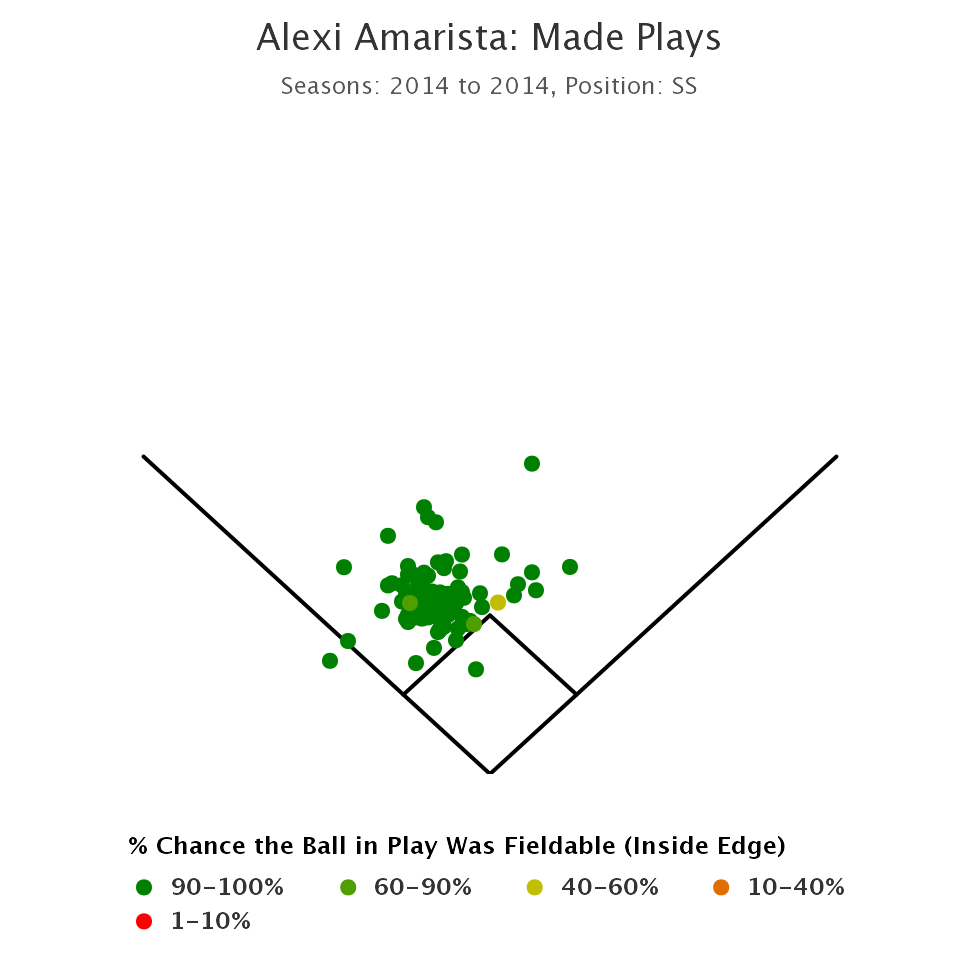
So here’s the thing: almost every play Amarista has made in 2014 was a play he was supposed to make. Even though many of these looked outside of his zone, the trained statisticians working for Inside Edge did not believe these balls were harder than routine plays.
And how about those misses?
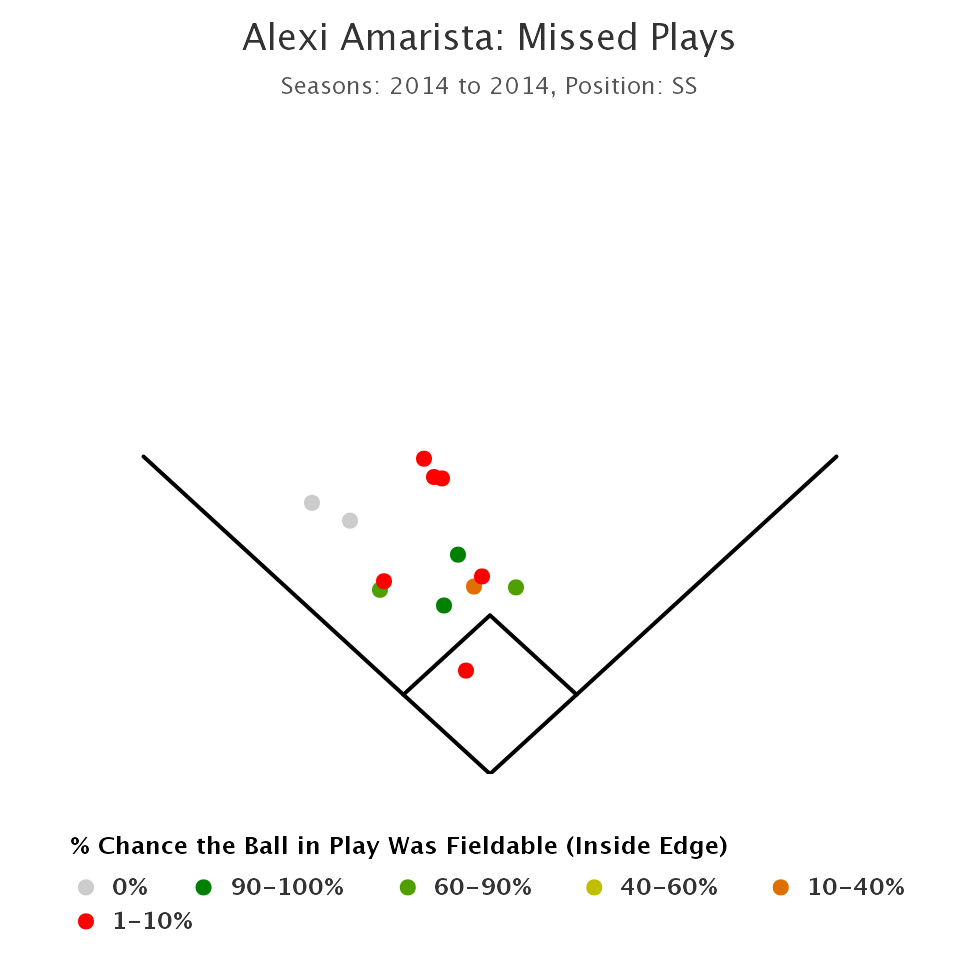
Like 2012/2013, a lot of these weren’t fieldable. However, he actually has one more routine play that has gone unfielded in 2014 than he did in 2012/2013, which makes sense given the roughly 2/1 ratio of attempts between the two samples.
More importantly: if you take a look at the table where all his attempts are aggregated, you’ll see that his fielding percentage in each zone is basically the exact same between 2012/2013 and 2014:
| Year | Innings | 0% | 1-10% | 10-40% | 40-60% | 60-90% | 90-100% |
|---|---|---|---|---|---|---|---|
| 2012/2013 | 156.2 | 0% | 0% | 20.0% | 100% | 62.5% | 98.0% |
| 2014 | 315.2 | 0% | 0% | 0% | 100% | 60.0% | 98.2% |
Conclusion
Amarista is not fielding better at shortstop in 2014 than he was in 2012/2013. At least not when you look at each individual play he has made/missed across the two samples. That we think he is better is a result of both:
- People claiming he was horrible in the past based on his UZR.
- The wider range of his routine plays in 2014.
More than anything, though, it’s #1. This should teach us a valuable lesson: UZR is completely nonsense in very small sample sizes. You’d think this would obvious when it’s stated directly in the Fangraphs’ glossary for UZR:
Beware of sample sizes! If a player only spent 50 innings at a position last season, it’d be a good idea not to draw too many conclusions from their UZR score over that time. Like with any defensive statistic, you should always use three years of UZR data before trying to draw any conclusions on the true talent level of a fielder.
Why is small sample such a huge issue with UZR? A huge reason is that UZR is a largely-adjusted statistic, adjusting for “park factor, batted ball speed, which side of the plate the batter was hitting from, the pitcher’s groundball/flyball ratio and the number of baserunners and outs at the time.” It is designed to work on large sample aggregates, not on individual plays or a small sample of individual plays.
The simple conclusion is this: Alexi Amarista is not and never was a great defensive shortstop. He also isn’t and probably never was a really poor defensive shortstop. If someone tells you he’s great, it’s probably because they’re overrating the wider range but-still-routine plays he has made in 2014. Likewise, if someone tells you he’s horrible, it’s probably because they’re quoting a statistic that holds no water over such a short period.
