
In case you aren’t aware, Hall of Fame voting for 2016 is ongoing, and Trevor Hoffman is one of the names on that ballot. Over the past week or two, I’ve read a handful of stories and tweets from top baseball analysts about Trevor Hoffman’s accomplishments and Hall of Fame candidacy. Some of them have been great reads and the overwhelming majority have been positive.
But so many of them left out or glanced over some critical aspects of Hoffman’s case, and not a single one mentioned how W.A.R. for late-inning NL pitchers is fundamentally broken.
Combined, the effect was that it made it seem as if Hoffman’s slam dunk candidacy was more like a question mark, rather than a first ballot induction.
In addition to spelling out exactly how W.A.R. is fundamentally broken for late-inning NL pitchers, I’ll hit on a few other areas that haven’t yet been covered.
The basics
We all know the basics. But just to recap and make this as complete as possible, let’s review them.
Trevor Hoffman was one of the longest tenured and most successful closers of all-time, clearly visible in the sheer volume of saves – a short-lived Major League record – he racked up over his illustrious career: 601. He was a two-time runner-up for the National League Cy Young award, and retired with 1.07 Cy Young “shares” (based roughly on percentage of votes received for the award). While other Hall of Fame relievers actually won a Cy Young award, Hoffman is basically right in the smack middle of that group in terms of Cy Young shares, trailing Eckersley (1.24), Sutter (1.14), and Fingers (1.13), while leading Rivera (1.04) and Gossage (0.35). Hoffman was more distant in MVP voting, but still managed to procure 0.41 MVP “shares”. The accolades continue: 7 All-Star Game appearances, 2 NL Rolaids Relief Pitcher of the Year awards, multiple ‘Pitcher of the Month’ awards, 2 Major League saves titles.
But those are just the basics. Where Hoffman really sets himself apart from other closers on the ballot in recent seasons are in the rate statistics.
Rate statistics
Trevor ranks 7th all-time in hits allowed per nine innings, a list which starts with the names Nolan Ryan, Clayton Kershaw, and Sandy Koufax. The guy right behind Trevor? Mariano Rivera. Pedro Martinez, Randy Johnson, and Bob Gibson, among many other notable names, sit further down that list, looking up at Trevor. Many, many Hall of Famers gave up at least a full hit more than Trevor per nine innings: Sutton, Newhouser, Carlton, Rusie, Lemon, Drysdale, Marichal, Bunning, Chesbro, Gomez, Jenkins, Spahn, and so on. This despite his career basically spanning one of the most hitter friendly eras of all-time: the “steroid era”.
Similarly, Trevor ranks 8th all-time in strikeout per nine innings, a list also featuring Nolan Ryan and Clayton Kershaw just above Trevor. It doesn’t really need to be mentioned again, but that leaves a lot of Hall of Famers, and future Hall of Famers, looking up at Trevor. Hell, every other Hall of Fame relief pitcher (including Mariano Rivera) struck out at least one fewer batter per nine innings than Trevor.
There are more statistics where I can point out the same thing: Trevor’s 7th in career WHIP and 9th in strikeouts to walk ratio.
This isn’t just a case of small sample size either, as both of those lists have innings pitched minimums set at one-thousand. Even if it didn’t, Trevor is ranked 10th all-time in games played as a pitcher. If that matters to you (and if not, no harm).
Off-the-field accomplishments
Trevor even won awards for his abilities off the field.
He won the Hutch Award in 2004, “given annually to an active Major League Baseball player who best exemplifies the fighting spirit and competitive desire of Fred Hutchinson”, the Lou Gehrig Memorial Award in 2006, “given annually to a Major League Baseball player who best exhibits the character and integrity of Lou Gehrig”, and the Branch Rickey Award in 2008, “given annually to a Major League Baseball player in recognition of his exceptional community service.” Only Paul Molitor, Curt Schilling, and Jaime Moyer can say the same thing.
Based on all this – along with the fact that Hoffman has never been named in any investigation on the use of performance enhancing drugs, a major reason why many worthy candidates from the era have been withheld from the Hall of Fame – and Hoffman would appear to be a shoe-in for the Hall of Fame.
Hoffman v. Mariano was closer (!) than you think
When talking about relief pitchers, the gold standard will always be Mariano Rivera (until a better relief pitcher comes around).
Let’s get this out of the way, then: Mariano Rivera was certainly a better pitcher than Trevor, and was probably a better closer than Trevor because he was a better pitcher.
But Mariano wasn’t better than Trevor at everything. In fact, they were largely great at what the other man was just good at, their skills complimenting one another like their career-long AL/NL dichotomy.
Hoffman’s signature pitch was a changeup. Mariano made his name throwing a cut fastball.
20.2% of Hoffman’s strikes were swings and misses. 16.4% of Mariano’s strikes were swings and misses.
Hoffman struck out 5.94% of batters on three pitches. Mariano struck out 4.46% of batters on three pitches.
Opponents’ batting average against Trevor Hoffman was .211. Opponents’ batting average against Mariano Rivera was .211.
Both players’ most similar player, according to Baseball Reference’s similarity score, is the other.
Going back to 1990, Trevor Hoffman owns two seasons better than Mariano Rivera’s best season (ranked 20th): the 4th best (1998 season) and 11th best (1996). The only other player with multiple seasons in the top twenty are Brad Lidge and Eric Gagne, although both of their bests don’t surpass Hoffman’s.
In-line with that thought, Trevor Hoffman performed better in save situations than non-save situations: roughly 10% better according to OPS+, with improvements to both opponents’ average (6 points lower) and on-base percentage (16 points lower).
Consulting leverage indices further validates. Hoffman performed worse in low leverage situations than either middle or high leverage situations, while Mariano Rivera’s followed the classic mold, performing worst in high leverage situations and best in low leverage situations. In fact, Hoffman holds a narrow advantage in both opponents’ average (ten points) and opponents’ on-base percentage (three points) if you strip away low leverage situations.
This isn’t to say that Mariano wasn’t a better person to have in the ninth inning of a close game than Trevor Hoffman. But if one was going to argue that such a thing as a closer attribute exists, you’d have to conclude that Hoffman’s closer attribute exceeds Rivera’s.
From a preliminary look at the other arguments against Trevor Hoffman’s inductions, the topic of Petco Park is frequently brought up, as is the fact he played in the National League.
50.3% of the batters Hoffman faced played for winning teams. 47.5% of the batters Rivera faced played for winning teams.
Closers, at least in save situations, will never face an opposing pitcher. (Over Hoffman’s roughly 5000 batters faced, just 25 were pitchers, all in non-save situations.) That’s because when the game is on the line, the opposing manager will pinch hit for any pitcher (if that slot even comes up). While someone could argue that the designated hitter is often a more valuable hitter than this pinch hitter, it isn’t like that pinch hitter is hot garbage. Often times, a starting position player with a day off is that ninth inning pinch hitter.
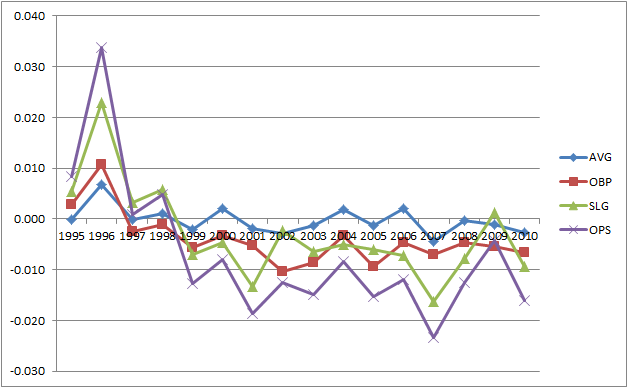
This isn’t just speculation, either. Take a look at the following chart, plotting the difference between American League and National League non-pitcher batting statistics over the years that Trevor Hoffman and Mariano Rivera shared in the Major Leagues, 1995-2010.

And once you remove their own teams from those league averages, the result is slightly more in favor of the argument that Rivera actually faced easier competition:
As a result, league-wide adjustments used when putting the statistics of closers into something context-neutral actually does as much harm as it does good.
And in a day and age where personal catchers are a thing, and pitch framing is widely cited, it should at least be noted that 50.3% of Mariano Rivera’s innings were caught by one catcher: Jorge Posada. Trevor Hoffman had no such luxury; the highest percentage of innings caught by any catcher in Hoffman’s career was 12.2% by Brad Ausmus. Mariano Rivera actually spent more time with his number two, Joe Girardi, than Hoffman did with Ausmus.
Again, I’m not stating that Hoffman was a better pitcher than Mariano Rivera. I’m stating that it was much closer than the general public believes.
NL late-inning relief pitcher W.A.R. is broken
I think it’s important to preface this section by stating that I like W.A.R.. In general, W.A.R. provides fans with a tool that allows rough comparisons across environments and eras in a more coherent fashion than, say, homeruns and wins. And as someone who works in data analytics for a living, I certainly do appreciate having a normalized value to reference as a tool for these sorts of questions.
One reason, other than its own merits, that baseball fans quote W.A.R. for relief pitchers is that many people justifiably point out that the save statistic isn’t the greatest of statistics based on its broad definition. But like arguments against a save threshold (sorta like the 3,000 hits artificial threshold) for automatic induction into the Hall of Fame, we probably should shy away from W.A.R. thresholds for automatic exclusion.
Mainly, though, voters shouldn’t focus entirely on one statistic in the same way that humans shouldn’t consume only health bars, even if the bar is designed to replace an entire diet. Yes, if you could only choose one statistic, that might be W.A.R., but no one is forcing anyone to pick just one. (Nor, as it turns out below, is W.A.R. the best one for late inning NL relievers anyway.)
By-and-large, that – voters not focusing on just one statistic – is already somewhat true. After all, Carlos Delgado just fell off the Hall of Fame ballot with 43.5 W.A.R., more than Mariano Rivera, who will surely be elected to the Hall when he becomes eligible. The Hall of Fame inductions of relief pitchers Goose Gossage, Hoyt Wilhelm, Rollie Fingers, Bruce Sutter, and Dennis Eckersley provide further proof that positional differences are already in the mind of the voter when assessing W.A.R. values, and that no such exclusionary W.A.R. threshold has been used historically.
The argument against Hoffman due to a W.A.R. value less than many other candidates is already a moot point, then, with precedent clearly set against such a rigid definition. Why start now?
More poignantly, though, W.A.R. for Hoffman needs to be ingested with a grain of salt since wins above replacement is broken for relief pitchers in general, and especially broken for late-inning relief pitchers in the National League.
That’s because W.A.R. uses a one-size-fits-all approach to adjusting raw numbers to a context neutral environment despite the fact that the actual quality of hitter faced by a late-inning relief pitcher in the National League is significantly different than the quality of hitter faced by the rest of the National League.
Namely, closers in the NL do not face opposing pitchers. The rest of the NL does get to face opposing pitchers. So when the bulk adjustment to National League pitchers is performed when calculating W.A.R., closers are penalized because the adjusting factor assumes closers face competition equivalent to the rest of the league. Obviously, that isn’t the actual case, and until W.A.R. weighs every batter faced based on that specific batter’s quality, pitching W.A.R. needs to be treated suspiciously (or as nonsense) for the National League.
This is no small effect, either. Recent NL inductees Tom Glavine and Greg Maddux faced opposing pitchers in 7.14% and 7.10% of plate appearances against them. Trevor Hoffman (and similarly, Billy Wagner) faced an opposing pitcher in 0.56% (and 0.25% for Wagner, who did spend one season in the AL) of plate appearances, with zero of them occurring in save situations.
And yet the exact same adjustment is made to Hoffman and Wagner’s pitching run component of W.A.R. (at Fangraphs) for playing in the National League as is made to Maddux and Glavine’s pitching run component of W.A.R. for playing in the National League. In Baseball Reference’s version of W.A.R., there is an adjustment for quality of team faced, but the adjustment still fails to account for individual batter quality – it too is broken for NL late-inning relievers.
That is obviously a large error, significantly reducing the W.A.R. compiled for late-inning relievers who spent any time in the NL, let alone their entire career. (This same error also artificially inflates the W.A.R. values for all other NL pitchers.)
One could quibble that the typical pinch hitter is weaker than a standard batter, and that’s probably a true statement. However, often times the batter is a starting position player who had a day off, a player with no real defensive position but can hit, and so on. At the very least, the difference between a pinch hitter and an MLB regular is surely closer than the difference between that pinch hitter and a pitcher…and probably by an order of magnitude.
At any rate, until W.A.R. actually adjusts for the exact quality of each opposing batter the pitcher faces, W.A.R. will continue to be misleading and, in fact, wrong for niche players who do not face a sub-population of hitters equivalent to the global, league population.
On top of that, both Fangraphs and Baseball Reference introduced additional adjustments made against relief pitchers (and in favor of starters). The adjustment is not entirely due to the relative ease that starters have historically transitioned to relief pitcher, though.
Adjusting relief pitcher W.A.R., even if it’s mathematically valid, means that positional difference should no longer be a part of the Hall of Fame conversation. Intellectually, you can’t both adjust W.A.R. for relief pitchers and then, when citing his W.A.R., argue that he’s just a relief pitcher. To do so would be committing the baseball analytic equivalent to double jeopardy.
But here’s the thing: the relief pitcher adjustment is not mathematically correct for closers. Fangraphs explicitly states that part of the adjustment factor is due to two main factors:
[Relievers] are selectively managed to face hitters whom they have the best chance of getting out, and they get to throw at maximum effort on nearly every pitch, giving them greater velocity over their shorter appearances.
Given all the fury against voters who don’t use advanced analytic metrics when justifying a Hall of Fame ballot, you’d think many voters would be well-versed in how W.A.R. is actually calculated. Based on the early arguments against Hoffman, it’s very clear that isn’t the case. Voters are just as mindlessly citing W.A.R. against Hoffman as those voters punching the ballot based on 600 saves.
But make no mistake: W.A.R. is broken for NL late-inning relief pitchers. And Trevor Hoffman shouldn’t be penalized because for the mistake of a statistician.
Use WPA instead of WAR
If not W.A.R., then what? Well, there’s always Win Probability Added, which examines how much a player’s actions changed the status of the game, contributing win percentage based on historical evidence on similar changes in game states. For example, if the Padres have a 90% chance of winning at the beginning of the 9th inning and Hoffman shuts the door, the act of bringing the Padres chance of winning from 90% to 100% means Hoffman is attributed with 0.1 wins.
Trevor Hoffman is 18th all time in WPA by pitchers. He led all of baseball in pitching WPA in 1998, had a third place finish in 1996, and had a seventh place finish in 1999. He had two other top ten NL finishes.
I could dig into the minutia of Hoffman’s WPA accomplishments some more, but there’s a more important related question.
Should we even remove context anyway?
Using W.A.R. for relief pitchers is somewhat misleading to begin with, as the use pattern for relief pitchers is heavily contextual.
Of course, relieving is easier than starting. That has been proven by the Sabermetric community, largely by examining starting and relief numbers for players who shuffled between both roles. Some voters want to penalize relief pitchers for that fact by reasoning that many starting pitchers who will not reach the Hall of Fame would have been better relievers than Hoffman.
Interestingly, wins above replacement already incorporates an adjustment factor for this effect:
The distribution of pitching talent is skewed very heavily towards the rotation, and because of this and the extra skills required to pitch 5+ innings per start, we use different replacement levels for starting and relieving in order to capture the additional value added by starting pitchers above and beyond simple run prevention.
But the logic in penalizing relievers based on the ability of starters to transition to the bullpen would mean that baseball writers should award all Gold Glove awards to shortstops, since they could all play other positions more effectively, and is similar to refusing to induct Antonio Gates into the NFL Hall of Fame because LeBron James would have been better in that role, or refusing to give military medals to ordinary soldiers because every sniper would have done a better job.
Mainly, though, Hall voters can’t both site W.A.R. differences and make a point about excluding a particular pitcher for being a reliever since W.A.R. already makes a large correction for that effect. That’s to say nothing of the fact that the effect is an aggregate one that isn’t necessarily true of all starters and relievers.
The Hall of Fame is (or should be) about celebrating what did happen, not what alternatives could have happened or which players would project better if they were forced to do their entire careers over.
The extension of that thought for a situational player like a closer is particularly curious. Does save percentage matter?
Assuming equal leverage indices, if Trevor Hoffman went 9 for 10 in save situations while allowing 3 runs over those 10 innings, is that not a better job than the closer who went 8 for 10 in save situations while allowing 3 runs over those 10 innings? They may be equivalent pitchers from a predictive standpoint, but is the Hall of Fame in the business of rewarding votes based on a player’s ability to replicate their success if we could simulate their career many times?
I would hope not.
Otherwise, Jack Morris’s postseason success shouldn’t have been a factor in his induction. Ignore Schilling’s bloody sock and be sure to forget Bumgarner’s October magic when he’s up for the Hall vote two decades from now.

Great point about how Hoffman never got to face the Padres and Rivera never faced the Yankees.
LikeLike
Also, I’d be interested in comparing the two with DRA.
LikeLike