
A common refrain from fans is that we need to give this “new” ownership time to establish itself, and this time it’s different: they’re actually spending money. The first part can be easily disproven, this ownership group has now owned the team for six and a half years, and Ron Fowler has been an owner for the last ten years, including his tenure with the Moorad ownership group. The second point is fuzzy. There are many ways to compute payroll, and in many cases, fans and the local media take the Padres’ Major League payroll numbers and then tack on international and draft spending, while comparing it back to the rest of Major League Baseball’s big league payrolls; not an apples to apples comparison. To my knowledge, information including Major League payrolls, draft spending, and international spending has never been compiled in one place, making it difficult to do a true comparison. The Padres, responding to fans protesting years of low big league payrolls, have always responded with “we spend! look at the international spending!” So my goal was to find out where the Padres total spending falls within Major League baseball so we can properly address whether this ownership group is actually spending enough to field a championship team.
There is no perfect method to aggregate this data. Different sources have different methodologies for something fairly straight forward like Opening Day payroll. Some just total up the 25 salaries on the opening day roster, some add in players on the disabled list, some include dead money, some include minor leaguers making more than the average salary or bonus. International is incredibly hard to collect information on. Sources have gotten better in recent years, and some teams fanbases have blogs that offer really extensive coverage of international scouting/signings (Padres and Red Sox appear to have the best). But even the best coverage can’t uncover things like Venezuelan bonuses which are kept hidden to prevent kidnappings, nor is there coverage of the multitude of $5k-$50k bonuses that get paid out to tons of off the radar players in each system. Full draft bonuses paid out are also difficult to find for all teams for all years. As a result, I developed a list of assumptions to use so that all data is treated uniformly:
- I used Spotrac payroll for MLB payroll figures. Generally I don’t like Spotrac because they do a poor job of projecting future payroll during the offseason. But,
- they are the most extensive publicly available database that includes all of these: 25-man salaries, disabled list salaries, retained salary/dead money, “buried” salary which includes players in the minors that were paid out bonuses or higher salary minor league contracts.
- For Venezuelan international bonuses, I generally used $300k as a plug number. Many of the bonuses will be much, much higher, many will be lower. There needed to be a baseline figure used.
- For MLB draft spending, when available, I used actual spend on bonuses. In cases where these were not available, I used the draft bonus pool for each team. In most cases, I found that actual bonus spending was +/- 5% of the pool. Since the advent of the hard capped bonus pools in MLB, with the exception of when a team can’t come to an agreement with a player, essentially spends it’s entire bonus pool. This is the basic ante in today’s baseball environment. In cases where they don’t sign (Brady Aiken for instance), that pool is added to the next season’s pool, which over the 5 years being tracked here, comes out in the wash.
- I used a five year period as a baseline for long term analysis. It should be noted that as the newest CBA placed hard caps on international spending, much of the wide variances in international have been negotiated out of the system. Were another 5 year analysis performed after 2021, the range from highest spender to lowest spender would be much, much lower, and the top end could only theoretically top out at about $35-40M in spend (after theoretically repeatedly trading for international cap space), as opposed to this analysis’ top spender, the Dodgers, having spent $131M, while the low spender, the Orioles, only spent $3.3M.
- I counted the entire signing period of signings against the year the signing period began. For instance, the Dodgers signed Yordan Alvarez at the end of the 2015-2016 signing period (so in summer 2016). I applied this to 2015 as the large majority of each signing period is signed on Signing Day. This is also consistent with my treatment of accrued penalties.
- For International penalties for exceeding the soft cap in 2014-2016, I assessed the penalty money to the year they were incurred. In reality, the Padres’ penalty money from their 2016 splurge was paid out in July 2017. From a yearly cashflow perspective, it would have been more accurate to include these in 2017’s numbers, but it’s also difficult to find some of the exact penalty numbers for all teams. Since this was a five year analysis, whether they are assessed in 2016 or 2017 shouldn’t affect the overall analysis.
Let’s start with the good news. The Padres HAVE spent on international players and draft bonuses. In fact, they are among the MLB leaders in both categories, coming in 2nd in both.


The spending on international players was just as advertised. The Padres went big in 2016, accrued big penalties, and made themselves one of the league leaders in overall international spending. From the Padres perspective, it’s unfortunate that the only team that spent more was their divisional rivals, the Dodgers. The Dodgers essentially did what the Padres did except a year earlier and they went way bigger.
*** Just a fun aside here. This is either a case of kicking the Dodgers in the nuts, or a larger statement on the unpredictability of international investments. The Dodgers spent a ton in the 2015-2016 signing period. 3 to 4 years later, they have gotten very little for their investment. Including penalties, the Dodgers spent over $95M on Yadier Alvarez, Yusniel Diaz, Yordan Alvarez and Yaisel Sierra. Sierra was outrighted off the 40 man roster in mid 2016. Yadier Alvarez, who throws the easiest 99-100 I’ve seen in person but can’t find the plate, was once a top 100 prospect, now is not in Sickels’ Dodgers top 20 for 2019. Yordan Alvarez was traded for RP Josh Fields in August 2016. Yusniel Diaz was traded as the centerpiece of the Manny Machado rental trade this season. In fact, out of the entire 2015-2016 international class for the Dodgers, only two players appear in Sickels’ top 20 for 2019: INF Omar Estevez ($12M with penalty) is currently 9th in the system, SS Ronny Brito ($4M with penalty) is currently 15th in the system. As of now the Padres look to be in better shape with their 2016 signings, but we’ll learn a lot this season. The Padres have had some successes so far including Adrian Morejon, Luis Patino, and Michel Baez, but they have had some possible flame outs as well including Jorge Ona and Luis Almanzar. Either way, as we stand today, their class is looking to be more valuable than the Dodgers’ more expensive 2015-2016 class.
The Padres have also spent the 2nd most on draft bonuses. As far as draft bonuses go, this is more a statement of how consistently bad the Padres have been over this five year window. In general, every team spends either just below or just above their draft bonus pool. The bonus pool is assigned by how good or bad the team was the season before and is tied to their draft position. So the Padres spending the 2nd most in draft bonuses is really saying that they had the 2nd highest draft bonus pool during this period. Regardless, credit where it’s due, they have actually spent their draft bonus pool, and that money had to come out of somewhere. They have also, in recent years, been one of the teams spending slightly higher than their assigned bonus pool (this is possible because low dollar signings don’t count against the pool).
Let’s move onto Major League payroll. This is generally where most fans have had consternation with ownership as this is the product fans are asked to pay full price to see at Petco Park. This is what the media covers, and this is the level that actually matters the end (as we’ll see later).
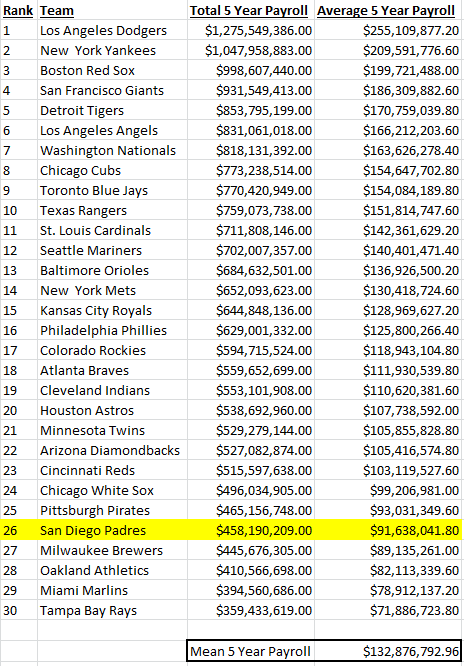
There is no question that the Padres are one of the cheapest teams during this period when it comes to Major League spending. They have spent the 26th most on payroll during this period, and have averaged a Major League payroll $41M below the league’s mean during that period. They are last in the division in payroll by a wide margin, and not even close to the “Mike Dee Middle Of The League In Payroll”, which was actually anywhere in the 11-20 range, generally as close to 20th as possible while still saying they’re in the middle of the league in payroll. The last five World Series Champions are sitting 4th, 15th, 8th, 20th, and 3rd. Some surprising notes for me were how the supposedly tanking Braves have maintained a Major League payroll high enough to still be 18th on this list. Also, the Royals, who are traditionally thought of as a low payroll team, have maintained a payroll high enough to be 15th on this list, averaging $37M higher per season than the Padres.
The whole point of this exercise, given that the Padres have told us don’t worry about Major League spending, look at ALL spending, is to see how the Padres overall spending stacks up. After all, while the Padres’ Major League payroll is near the bottom of all teams, they ranked 2nd in international and draft spending. The theory, of course, is that the international/draft spending will make up for fielding such a cheap team the last five years.
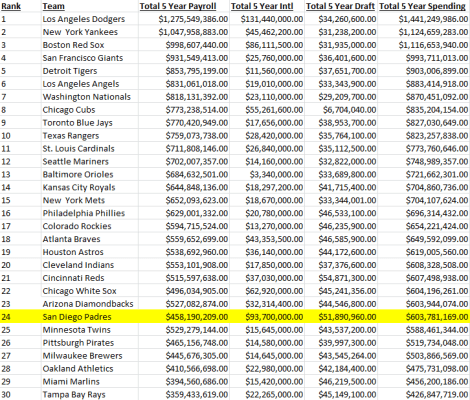
The theory is partially true. While the Padres were 26th in Major League payroll, the international and draft spending was enough to boost their total spending up to 24th in MLB, very narrowly behind the rival Diamondbacks and rebuild partners White Sox (although the D-backs would have been #22 had they signed their 2018 first round pick). On an annualized basis, here is the mean yearly spending over the last five years:
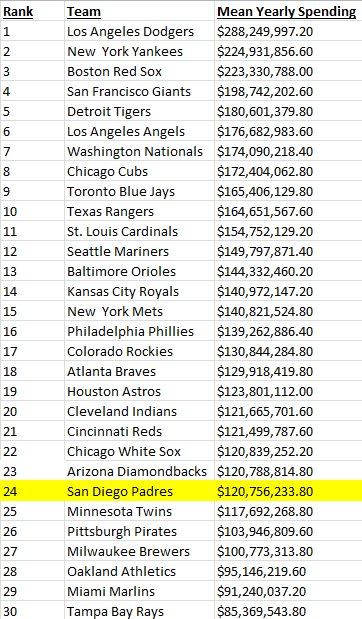
Even with the 2nd highest international and draft spending in baseball, the Padres were still only able to muster 24th in total spending. With the new CBA capping international spending at $5-7M per season and draft spending being capped, teams that put a low payroll team on the field don’t have as many channels to make up that spending elsewhere. This puts a particular focus on the Padres low 2017 and 2018 payrolls. Here are the details of how the Padres have spent their money over the past five years:
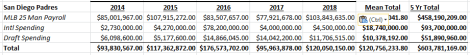
It’s apparent that there was an actual surge in total spending in 2016. This, of course, coincides with the international splurge. Under my assumptions, I assessed the incurred penalty against 2016 even though it was actually paid out in July 2017. Had I broken it out, Padres spending would have fallen below league average all five years. As it is, they did exceed the league average in 2016, but fell well below it the other four years.
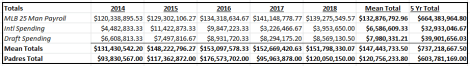
Across the five years, the Padres’ average total spending fell $27M per season below the MLB average. In the worst year, 2017, the Padres underspent the MLB average by $57M. Even in 2018 where the Padres spent the most in a non-international splurge season, they fell $27M below the 2018 MLB average spend. It’s clear that even with draft and international factored in, the Padres are nowhere near the league average, nor are they within the “middle of MLB spending”.
The lack of spending is more alarming given that the Padres have been immensely successful… not on the field of course, where the Padres have put up a record of 356-454 over the five years analyzed here. But off the field, the income statement has been very pleasing for ownership and the executive suite. After all, Erik Greupner was just promoted to a President role based on the financial success of the team. Mike Dee, who oversaw 2014-2016 of this analysis, was given a public defense by Peter Seidler during the 2016 season based on his success at improving profitability. The team has immensely profitable according to Forbes:
Operating Income
2014: $35M
2015: $29.6M
2016: $22.8M
2017: $26M
And there’s no reason to think this will be any different in 2018 given the low level of spending during that season, in addition to having received $50M in a lump payout from the sale of MLB Advanced Media which will pad the income statement. In addition to that, ownership’s equity has skyrocketed during this period of low spending. In 2014, Forbes estimated the club’s value to be $890M. In 2018, Forbes estimated the value had risen to $1.27B, an increase of $380M, or about $75M per year. Despite this drastic increase in value paired with large profits, fans have not seen that translate into league average spending (or even coming close to approaching league average spending). We have been told by Kevin Acee and Dennis Lin that ownership would like us to look at spending over a three year period, as if the vast profits will be fungible to other seasons within that three year period. Even with the benefit of the huge 2016 international spending, a three year average of 2016-2018 Padres spending is $130,862,576, which is still more than $22M below league average total spending for that period. Looking at the projected 2019 total spending for the Padres, it wouldn’t be surprising to see them over $50M below the average 2019 MLB total spending. With the cost control provided by capped international and draft spending, it’s clear the team has ample ceiling going into 2019 to afford any player they’d want, and this assumes that the talk of the massive profits being applied to future payrolls is just doubletalk from ownership and that that money will never be seen again. Even after that, it’s clear the Padres have tremendous financial flexibility after years of underspending the Major League average.
@Padres_Farm posted an interesting graphic of success in relation to an MLB average Major League payroll (payroll, not total spending, so exclusive of draft/intl where the Padres were 26th in baseball)
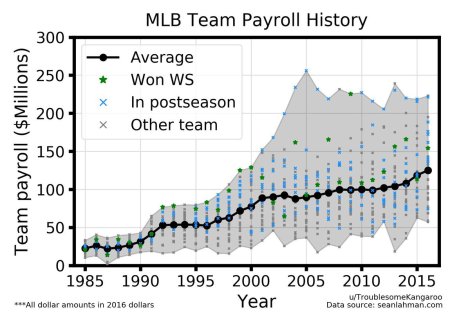
With the exception of the 2003 Marlins, the 2002 Angels, and 2015 Royals (who both were JUST below league average payroll), every World Series Champion since 1991 has had a league average payroll or higher. Of course, there are plenty of examples of playoff appearances for teams below the league average, but if the goal here is a World Series Championship, spending will need to substantially increase to league average.
At the point that the team is not deliberately tanking, there is no reason the Padres can’t or shouldn’t boost payroll and total spending EVERY SEASON FORWARD. While the international spending provided a one-time boost to the farm system, it’s important that the Padres find other ways to spend the rising revenues. Given the system as it is today created by the CBA, a capped draft and international signing period basically make Major League payroll the best and primary outlet for the spending. It’s time for the operating profits to be committed to the product on the field rather than ownership dividends or debt service.
